Planning for increased costs on Dairy farms in 2022
December 13, 2021
As we approach a new year, now is an opportune time to evaluate the financial health of your farm business. Input costs have been increasing and knowing your financial and physical numbers is key to helping you plan for the future. Figure 1 highlights the changes in costs of key farming inputs between August 2020 and August 2021.
Figure 1: Changes in costs of key farming inputs between August 2020 and August 2021
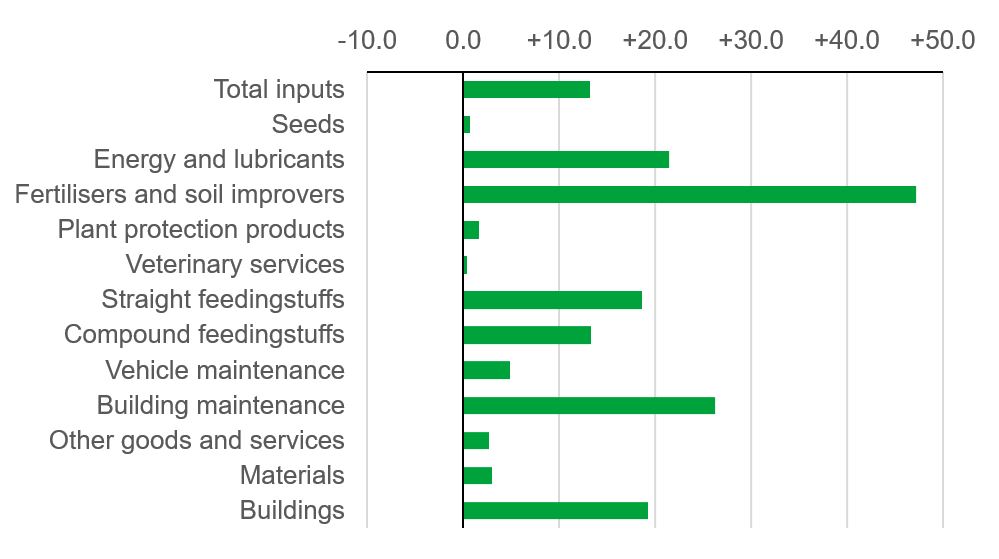
It is clear to see that there have been increases in all input costs, especially Energy, Fertiliser, Buildings and Feed costs and these costs have continued to rise since August 2022. CAFRE Dairy Financial Benchmarking enables farmers to examine costs on a, per cow, per hectare or pence per litre (ppl) basis and compare them to industry averages. The 2020/21 benchmarking figures show the difference in total cost of production for a litre of milk between the top 25% and bottom 25% of producers is 8.55ppl. Knowing your costs and the impact of increased input costs at farm level is vital. For example, for a typical benchmarked dairy farm, every increase of £32 in the cost of a tonne of concentrates adds 1.0 ppl to production costs while it takes an increase of £250 per tonne of fertiliser to add 1.0 ppl to costs. Therefore, efficient use of inputs to achieve improved productivity is paramount in your business.
Now is a good time to review fertiliser policy to identify any potential efficiencies that can be made. Soil analysis should be carried out and fertiliser requirements recalculated based on soil indices. Pay attention to pH; applying lime to correct deficiencies is a less expensive way to make better use of applied fertilisers. Nitrogen applied to a soil of pH 5.0 is 43% available but at pH 7.0 is 100% available. Target a pH of 6.5 on productive grassland. Some fields on the farm may not require P and K compounds, so a revised purchasing plan based on soil requirements is advised. Slurry application using Shallow Injection/Trailing Shoe methods have an increased amount of nitrogen available to the plant compared to Splash Plate application and should be used to further reduce fertiliser costs. Reducing the amount of fertiliser applied to a silage crop by 30% could result in a reduction in silage yield of 21%. On a highly stocked dairy farm this reduction in available home grown forage would have to be replaced by feeding more expensive concentrates or purchased forage. Therefore, before making any changes to planned fertiliser rates, ensure there will be sufficient forage to feed the herd next winter.
Concentrates are the largest input cost on a dairy farm and knowing the feed rate and benchmarking this against industry averages may provide the evidence to improve productivity on many farms. Analysing silage to formulate a feed plan, making better use of grazed grass, calibrating feeders and batching cows into appropriate production groups can improve productivity at farm level.
Electricity costs £35/cow on an average benchmarked farm but this ranges from £9 to £74 per cow. At farm level there is potential to reduce costs by installing plate coolers, heating water using cheaper night time tariffs, comparing different energy suppliers, using LED lights and investing in variable speed vacuum pumps for the dairy.
Knowing your farm Key Performance Indicators from Benchmarking is essential in helping the business plan for the future. The saying “You can manage it, if you can measure it” holds true in terms of financial fitness.
Banbridge Dairy farmer Gordon Mitchell has been benchmarking for a number of years and states
“Benchmarking allowed me to identify areas of weakness in my business and set clear targets for improvement especially now with input costs rising.”